Measuring the Similarity between Short English Phrases using Recurrent Neural Networks
In this post, I will give a high level description an algorithm I created while interning at Tableau for measuring the similarity of short English phrases. This algorithm is used in the natural language interface described in our paper Applying Pragmatics Principles for Interaction with Visual Analytics.

In the summer of 2016, my group at Tableau was working on building a system called Evizeon, which is natural language interface that takes in English queries and produces visualizations in response. Say the user is examining a data set of pieces of real estate which contains information with location, neighborhood, square footage, and price. The user might ask for the “most expensive houses in Queen Anne,” where Queen Anne is a neighborhood. The system must now figure out that “expensive” refers to price, and a high price in particular. The system must also infer that Queen Anne refers to the neighborhood the house is in. In the end, we would like the system to display the houses with the highest prices in the Queen Anne neighborhood. Our system is able to correctly answer this query.
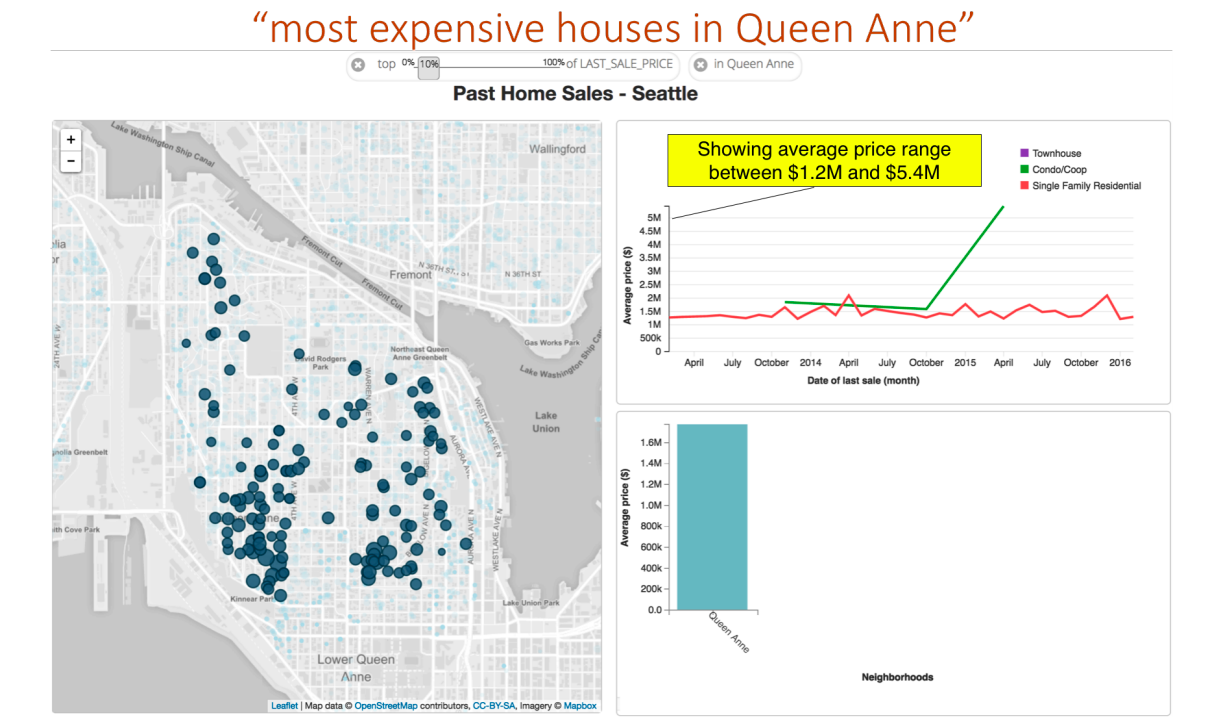 This screenshot from the Evizeon system shows the visualizations that result from the query “most expensive houses in Queen Anne.”
My contribution to this project was the algorithm that matches short phrases to data columns. In the case above, my system matches “expensive” to the home_price attribute and determines that the user wants items with the highest price. My system is not responsible for identifying which phrases in the input need to be matched with data columns; that is handled separately.
Word Embedding Spaces
The next section assumes basic familiarity with word embeddings, so I will provide a brief overview of them here. In essence, a word embedding is a space, usually high dimensional, in which each word occupies a point. This space is useful because, if the embedding space is well built, similar words will appear near each other and unrelated words will be far apart. Word embedding spaces have many other interesting properties, such as providing representations of words that can make solving simple analogies like man : woman :: king : queen easy. For the purposes of this article, it is sufficient to know that each word has a place in the embedding space, and similar words are close to each other. Note that usually, proximity is measured with cosine distance instead of Euclidean distance.
The particular embedding that I use in this paper is trained by Hill et al. using the word2vec algorithm.

Mapping Phrases into a Word Embedding Space
In order to take a query phrase and select the most similar column description phrase, we need some way to measure similarity between short English phrases. Methods exist for comparing long English documents using features like shared words. One such method is creating a vector for each document where each position in the vector holds the number of times a certain words appears in that document. If two documents share many words, these vectors will have a high cosine similarity. There are many algorithms that improve upon this strategy, but this is the basic idea. These algorithms work well on large documents with many words, but two short phrases meaning exactly the same thing like “high price” and “expensive” will very likely have no words in common, so word counting based approaches will not work well.
One possible approach to solving this problem might be to train a model to take in two phrases and predict their similarity. The difficulty of this is that it would require a large data set of pairs of similar and dissimilar short phrases. I know of no such data set. Rather than training on the phrase similarity task directly, I used a domain adaptation approach where I adapted a model that embeds phrases into a word embedding space in which distance measurements are easy. Given a vector in a word embedding space for each phrase, I will use the cosine similarity between these phrase vectors to measure the similarity between phrases. Now I needed a way to place phrases into a word embedding space so that similar phrases end up near each other.
One model which maps word sequences to word vectors was proposed by Hill et al. It is an RNN that takes in a dictionary definition and predicts the vector for the word that the definition corresponds to. Using this model, two dictionary definitions with the same meaning, like “costing a lot of money” and “having a high price” should map near the same vector for “expensive.” This seems a lot like the behavior we are looking for, as long as the domain adaptation from the domain of dictionary definitions to the domain of short English phrases works well.
I implemented the Hill et al. model in Tensorflow and trained it on the data set they provide. As a word of caution to those considering using this data themselves, there is an issue with the train/test split in the data they provide. By my count, about 71% of the holdout definitions are also in the training data. It looks like the issue is with definitions in the holdout set which have parentheses, semicolons, or numbers. Perhaps the system used to remove holdout definitions from the train set did the comparison without stripping those out, even though they were stripped from the training data. I have notified the authors of that paper about this.
I found that the Hill et al. model does in fact produce reasonable embedding space vectors for short phrases as well as actual dictionary definitions. Below is a diagram illustrating how the LSTM networks takes in two similar phrases and maps them near each other in the embedding space.

Ranking Phrases by Similarity to a Query
The task we are studying is not measuring the similarity between phrases, but rather ranking a number of data columns in order or relevance to a query. The label of a data column is only one piece of information we have about that column. A good tanking scheme will also take advantage of other information in the data column, such as words that appear in the data itself, and perhaps simple word matching features. For instance, if “Queen Anne” appears in a data column and a user asks for houses in Queen Anne, we would like the ranker to make the obvious choice to rank that column highly. To accomplish this, I created a number of hand crafted similarity features to go along with the phrase match feature. These features included verbatim word matches between query phrases and column contents and cosine distance between the average of the word vectors on the column header and the query. If the column contained members of a compact set, like one of 20 neighborhood names, I would also consider the cosine distance between the average of the word vectors of the members of that set and the average of the word vectors in the query. This tends to help pick out direct synonyms. All of these features are then fed into a logistic regressor that predicts the probability that a given column and phrase are a match. To train this logistic regressor, I hand labeled a set of query phrases with the best matching columns among some data sets that we used for testing Evizeon. This small data set was sufficient for training the simple logistic regression model.
This logistic regressor can give us, for any pair of columns, the probability that one column is a better match for the query than the other. We must now turn these pairwise orderings into a full ranking of all the columns. Below is an image of a graph representation of this problem. The nodes are columns and the directed edges between pairs of nodes denote the probability that the node the edge points to is a better match for the query than the source of the edge. In this case, we see that lots of high value edges point to “home price,” which makes sense, since it is a match for “expensive,” which is our query phrase.

Intuitively, we would like to rank these nodes by how much weight the models points into them, which is easy when only one node has lots of high value edges into it. But when multiple nodes are good matches for the input, we need to have a good way of deciding which is better. When deciding how highly to rank a node, we would probably prefer that it receive more ranking weight from nodes that themselves have a high value. This is a lot like the problem that the early Google Search prototype solved with the PageRank algorithm: pages with lots of links from websites that have lots of links pointing to them get highly ranked, and lend lots of weight to sites that they themselves point to. We will solve this problem in the same way they do, by treating this graph as a Markov chain where the outgoing weights from any node are normalized to be a valid probability distribution. We will then find the steady state of the markov chain, which will give us the probability for each node that a random walk around the chain will land on that node. This probability distribution will have the desired property that nodes pointed to with high weight by nodes that are themselves highly ranked will receive high rank. I found that this ranking scheme works very well in practice. This ranking scheme is the one used in Evizeon.
Conclusion
Our paper quotes a user who stated, “I did not think it would understand the word expensive… that blows my mind a little bit!” I think this is a great example of the value of this work. Tableau users are used to having to formally specify which data attributes they are referring to at all times through the Tableau GUI, and in the previous version of Evizeon, called Eviza, they had to be similarly rigorous in their references to the data when interacting with the system using English queries. The real promise of a system like Evizeon is to allow users who are unfamiliar with the source data to interact seamlessly with visualizations built from that data. Disambiguating their reference to data attributes is an important step toward this goal.